


Long ago, a cyclist’s performance was measured only by average and maximum speed, the gradient and the distance they could cover in a given time. These metrics still make some sense today, but for training they are only suitable at the very beginning.
Take speed, for example. For the same effort it is affected by wind (a headwind slows you down, a tailwind speeds you up), the gradient (climbing is obviously much harder than riding on the flat), road surface (smooth tarmac or gravel), tyre pressure, contact patch size, the aerodynamics of the bike and the rider’s position, weight and so on. So speed is a very telling parameter for racing, but for training it is far from clear-cut.
The same goes for the distance a rider covers. Again lots of nuances come into play: terrain, the number of turns and so on.
Heart rate monitors brought progress to training. Heart rate began to be compared with the speed reached and held. But this approach had one serious drawback: heart rate rises and falls with a delay, some time after the work has been done.
#Power meters
Progress did not stand still, and coaches and sports doctors, together with engineers, came up with entirely different measures of a racer’s work. A new device was invented to measure cyclists’ efficiency — the power meter, which measures the power produced in watts (W).
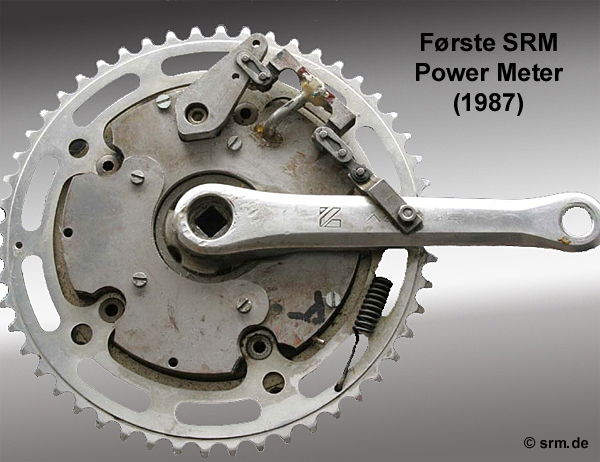
The first bicycle power meter was developed in 1986 and manufactured by the German company SRM (Schoberer Rad Meßtechnik). Its creator was the engineer Ulrich “Uli” Schoberer. He built the first working prototype himself, welding strain gauges onto an ordinary crank and converting a Casio calculator into a head unit to display the data. He patented the device in 1987.
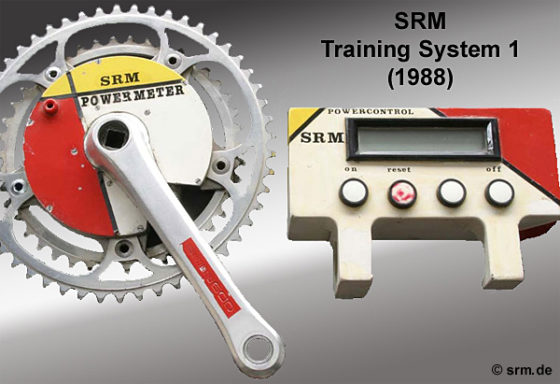
Production of the “SRM Training System 1” for sale began in 1988, and such a device cost close to $10,000.
Of course, modern power meters cost many times less and connect to a bike computer.
#What is FTP
FTP (Functional Threshold Power) is roughly the maximum average power (in watts) a cyclist can sustain for 60 minutes. In training, FTP is used as the baseline for calculating intensity zones (to build intervals, plan the load and assess progress).
The concept of Functional Threshold Power (FTP) was created by Dr Andrew Coggan.
#Andrew Coggan
An American exercise physiologist specialising in endurance training. Coggan was the first to propose linking the classic physiological concept of the “lactate threshold” (the anaerobic threshold) with the practical data that became available thanks to bicycle power meters.
The original definition of FTP:
FTP is the highest power a rider can maintain in a quasi-steady state without fatiguing (i.e. for approximately one hour).
The methodology for calculating FTP was devised by Andrew Coggan in the late 1990s, but it was only officially documented in 2006, co-authored with Hunter Allen.
#How to measure FTP
#1. 60′ FTP test
One of the most reliable methods: ride a maximal 60-minute effort at a steady pace and record the average power — that is your FTP. This method is accurate but physically and mentally tough.
#2. 20′ FTP test
This test is much more dynamic than the previous one. Here is how it works.
- Preparation: a good 20–30 min warm-up at a slightly below-average pace (with a few short 1–2′ efforts);
- The main test lasts 20 minutes of the most even effort possible (no surges).
- Calculation: FTP ≈ 0.95 × average power over 20 min.
Pros of this method: a relatively short, proven test; cons: it requires good pacing and slightly overstates the anaerobic contribution (hence the multiplier <1).
#3. 2×8′ FTP test
This test suits those who struggle with an even 20-minute format. It goes like this: two 8-minute maximal sustainable efforts (no surges) with 10 minutes of recovery between them.
The calculation is simple: FTP ≈ 0.90 × average power over the two intervals (coaches use different correction factors, but 0.9 is the most common).
#4. Ramp test (increasing power)
While the previous tests can be done on a bike on the road or track as well as on an indoor trainer, the ramp test is done only on a trainer.
FTP is estimated by the software controlling the trainer (based on peak power). Pros: mentally easier, the test is shorter (~10–15 min of high intensity). Cons: it reflects less accurately your ability to hold a steady hour; results depend on the software.
#FTP, watts per kilogram and level
FTP is the power you hold for about an hour. 20 minutes × 0.95; 2 × 8 minutes × 0.9; ramp (best minute) × 0.75; an hour ride — as is. Levels follow Andrew Coggan’s power profile table (Training and Racing with a Power Meter), rounded; zones — Coggan’s 7 zones from FTP.
#5. Laboratory tests
This method allows you to determine with scientific precision the power and exercise duration at which the maximal lactate steady state is reached — the boundary beyond which the muscles quickly become acidic. The test is carried out with various sensors and gas analysers attached to the athlete.
#FTP power zones
Based on FTP, coaches and the engineers of bike computers that connect to power meters developed power zones. Seven power zones are commonly used.
| Zone | Name | % of FTP | Interval duration |
|---|---|---|---|
| Z1 (grey) | Active Recovery | < 55% | Unlimited |
| Z2 (blue) | Endurance | 56 – 75% | Over 3 hours |
| Z3 (green) | Tempo / Sweet Spot | 76-90% | 20′ –60′ |
| Z4 (yellow) | Lactate Threshold | 91 — 105% | 10′ – 30′ |
| Z5 (orange) | VO₂max / Maximal oxygen uptake | 106 — 120% | 3′ – 8′ |
| Z6 (red) | Anaerobic Capacity | 121 — 150% | 30 sec. – 3 min. |
| Z7 (maroon) | Neuromuscular Power / Sprint | > 150% | 15 sec. – 30 sec. |
Sometimes Z6 and Z7 are combined into one zone — anaerobic power.
The training process is built on the zones calculated.
#Power zone calculator
| Zone | Power | W/kg | What it trains |
|---|---|---|---|
| Z1 Recovery0–55 % FTP | — | Warm-up, cool-down, recovery rides. You can sing. | |
| Z2 Endurance55–75 % FTP | — | The base of training: endurance, long rides. Easy conversation. | |
| Z3 Tempo75–90 % FTP | — | Tempo: long steady effort, fast group riding. You talk in phrases. | |
| Z4 Threshold90–105 % FTP | — | Threshold: 8–20 min intervals, time trial, long climb. Sweet spot — 88–94 % FTP, on the border of Z3 and Z4. | |
| Z5 VO2max105–120 % FTP | — | VO2max: 3–5 min intervals, attacks, short climbs. Very hard. | |
| Z6 Anaerobic120–150 % FTP | — | Anaerobic: efforts of 30 s – 2 min, surges and rollers. | |
| Z7 Sprintfrom 150 % FTP | — | Sprint: maximum for a few seconds. |
#Heart rate zones
- Z1 Very easy
- Z2 Easy
- Z3 Moderate
- Z4 Hard
- Z5 Maximum
Max HR by the Tanaka formula (208 − 0.7 × age) is an estimate; individuals vary by ±10 beats. Heart rate lags on short intervals: use power for them.
In your account, the plan is built on your FTP, and the analysis of every ride shows the time in these zones. Sign up
#Workout examples
Base endurance (Z2 work): long, unhurried rides of 2–6 hours — the base, the aerobic foundation.
Tempo (work in Z3 and low Z4): intervals of 2 × 20 to 3 × 15 min @ 88–95% with 10 min rest — great for improving your ability to sustain a high percentage of FTP.
Threshold (Z4 work): 3 × 10 to 2 × 20 min @ 95–105% FTP — develops the ability to hold high power.
VO2max (Z5 work): 4–6 × 3–5 min @ 110–120% FTP with equal or slightly longer rest — improves maximal aerobic power.
Anaerobic power intervals (Z6 work): 6–12 × 30–60 sec @ >120% FTP with 3–5 min rest — for explosive power, training surges and fighting for attacks.
Sprints (Z7 work): 6–12 × 10–15 sec @ > 200% FTP (all-out), full recovery — for finishes.
#Create a training plan in a minute
#Updating your FTP
It is recommended to do an FTP test and update your values every 4–10 weeks. How often depends on the intensity of your training.
#What is W/kg
We seem to have dealt with plain watts. Now let’s find out what another cycling parameter, W/kg, is. In cycling, W/kg is the power-to-weight ratio (often called “specific power”): the amount of power (in watts) a cyclist can produce per kilogram of body weight. The formula is simple: W/kg = Power (W) / Weight (kg). It can be calculated for a given moment or based on FTP.
It is the key metric that determines how fast an athlete can ride uphill.
A light 60 kg cyclist with an FTP of 300 W (5 W/kg) will ride away from a heavy 100 kg rider with the same 300 W FTP (3.3 W/kg), because they have less body mass to move uphill.
W/kg makes it possible to compare a “skinny climber” and a “powerful all-rounder” objectively.
For climbs and hard short efforts W/kg is critical; on the flat, absolute power and aerodynamics matter more. You can improve W/kg in two ways: increase power (training) and/or reduce mass (diet/body composition). Both should be done thoughtfully and safely.
#W/kg levels for men
| Fitness level | FTP (W/kg) | Description |
|---|---|---|
| Beginner | 1.5 — 2.5 | Holding speed |
| Amateur | 2.5 — 3.5 | Group rides, confident on flat terrain |
| Trained amateur | 3.5 — 4.5 | A strong rider able to compete in local races |
| Professional | 4.5 — 5.5 | Fights for race wins |
| Elite | 5.5+ | Racing the Tour de France, the Giro d’Italia, etc. |
World-class professionals (men) at peak form can hold 5.8–6.5 W/kg for 20–40 minutes on key mountain stages.
#W/kg levels for women
| Fitness level | FTP (W/kg) | Description |
|---|---|---|
| Beginner | 1.0 — 2.0 | Holding speed |
| Amateur | 2.0 — 3.0 | Group rides, confident on flat terrain |
| Trained amateur | 3.0- 4.0 | A strong rider able to compete in local races |
| Professional / Elite | 4.5+ | Fights for race wins |
#What are NP, IF, TSS and VI
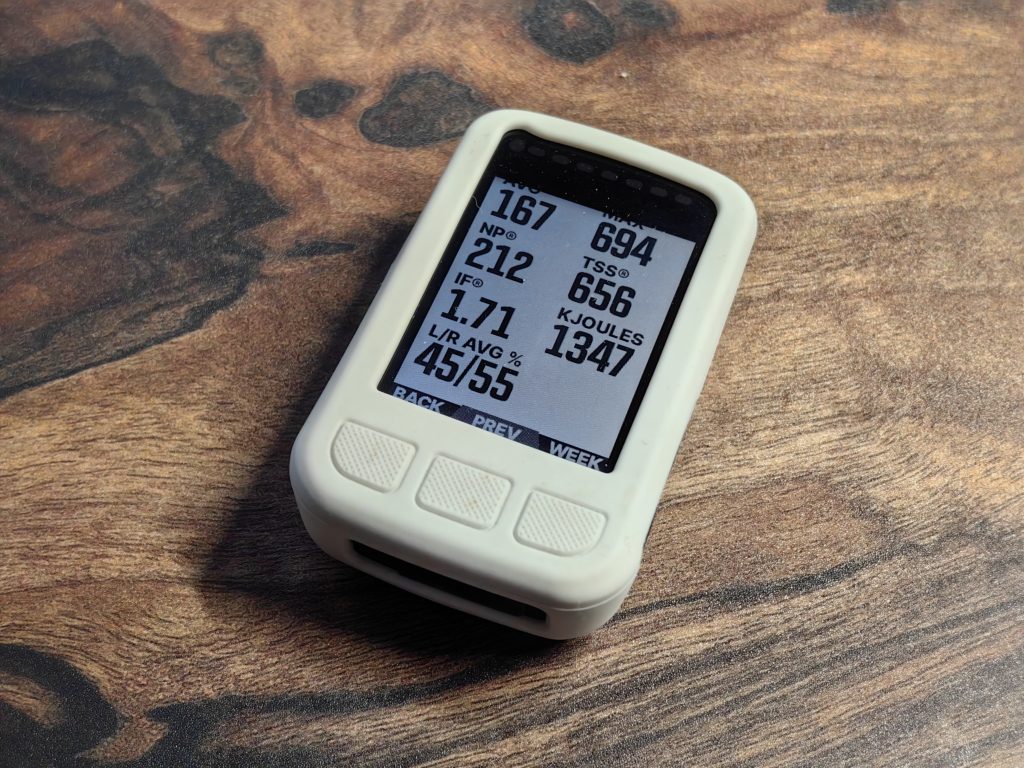
Every time you finish a ride on a trainer or bike using a power meter and a pro-level bike computer (such as Garmin or Wahoo), you get a summary of the work done. Among the parameters shown are metrics such as NP, IF, TSS and VI.
These metrics (except VI) were introduced in 2006 by Dr Andrew Coggan, an American exercise physiologist specialising in endurance training, and Hunter Allen, a former racer, now a coach and co-founder of TrainingPeaks.
Normalized Power® (NP), Intensity Factor® (IF) and Training Stress Score® (TSS) are registered trademarks of Peaksware, LLC (the parent company of the TrainingPeaks platform).
Let’s try to understand what they all mean.
NP (Normalized Power)
NP is the most important metric on this list.
Suppose your ride was on a course with varying gradients: there were descents and climbs. On the descents you worked at very low power (sometimes coasting or even braking), and then on the climbs you did very hard work: your average power (Avg Power) will be low, even though you may have given 100% on the climb and worked far above your FTP. Average power does not reflect the real load on the body on routes with varying terrain.
NP is a “smoothed” power. Your bike computer’s algorithm calculates the physiological load your body experienced. It gives more weight to the hard sections (because the body tires from peak efforts rather than from steady riding).
NP is always higher than your average power.
#IF (Intensity Factor)
IF estimates how hard the workout was for you personally. It is the ratio of normalized power to your threshold power (FTP), turning the load into a relative value. How it is calculated:
IF = NP / FTP.
How to read the result:
- below 0.75 — recovery or very easy riding.
- 0.75 – 0.85 — moderate aerobic (tempo) training.
- 0.85 – 0.95 — threshold training (hard but bearable).
- above 1.0 — very hard work (short intervals or a race).
IF was introduced as a simple way to compare the intensity of any workout with your baseline power (FTP). It answers the question:
How hard did I work relative to my maximum?
If your long rides consistently show IF > 1, you most likely need to retest your FTP.
#TSS (Training Stress Score)
TSS shows how tired you are “overall”. It takes into account both the duration and the intensity of the workout.
The formula is roughly:
TSS = (seconds * NP * IF) / (FTP * 3600) * 100
This metric is needed to compare different workouts with each other.
Rating scale:
- below 150 — low load (recovery or a short easy ride).
- 150 – 300 — medium load (a standard group ride or long aerobic work).
- 300 – 450 — high load (a race or a very long day in the mountains).
- above 500 — extreme load (a stage race, a very hard ultra ride).
#VI (Variability Index)
VI shows how “choppy” your pace was. Don’t confuse VI with heart rate variability (a cardiology parameter).
How it is calculated:
VI = NP / Avg Power.
VI shows how much your power varied during the ride. The closer VI is to 1, the steadier you rode. This is optimal for saving energy.
- 1.0 — perfectly steady riding (for example, on a track or on the flat).
- 1.0 – 1.1 — group riding at a steady pace but with turns on the front (again, without big gradients).
- above 1.2 — a “choppy” pace (frequent accelerations, hard braking, hills). This indicates non-optimal energy use: you spend energy accelerating where you could have kept your rhythm.
All four metrics — NP, IF, TSS and VI — were developed to make power-meter training analysis more accurate and meaningful. Their creation is linked to two key figures in the cycling world. The parameters described above were first presented to the general public in 2006 by Andrew Coggan and Hunter Allen. That was when the book “Training and Racing with a Power Meter” came out, systematising and describing these metrics.
Comments 1
Игорь Огаревauthor
Как вам материал?